
Smash Bet: Predicting Super Smash Bros Ultimate Tournament Winners
- Tim Beecher
- Sep 30, 2022
- 6 min read

One of the most popular video games across the world today is Super Smash Bros by Nintendo. With the first iteration releasing in 1999, "Smash" is a platform fighting game featuring some of the most popular video game characters from different franchises such as Mario, Pac Man, Sonic, Pikachu, Link and Captain Falcon. The most recent release, Super Smash Brothers: Ultimate, has several different modes and items but the simplest and fundamental objective of the game is to defeat the other opponent in a 1-on-1 battle.
In recent years, playing video games competitively has spawned into a multi-million dollar industry of esports. Tournaments have become major events taking place in major cities in expensive venues and often lasting an entire weekend. Smash Bros is one of those video games, featured in tournaments not only across the United States but internationally as well prominently in Japan, Mexico and the Caribbean. At the end of 2022, the Smash World Tour, a major, multi-event tournament, will have a prize pool of over $250,000.
Because of the lucrative and competitive nature of video games, particularly of Smash Bros Ultimate, several aspiring and professional players enter several tournaments throughout the course of the year. In addition several hundreds of people attend venues and thousands more live stream the tournaments, making these tournaments notable events in the esports community. Similar to the rise of betting in professional sports such as the NFL and NBA, esports betting is becoming an entertaining option for these Smash enthusiasts. However, unlike professional sports, there is a lack of predictive models forecasting the results of tournament sets between top Smash players.
I set out to create a model that will predict the outcome of Super Smash Bros Ultimate tournament matches between top players. My intention is that this will assist Smash Bros fans have an idea of the probability for the results of a given match and allow them freedom to make bets accordingly, if they wish to do so among friends. In creating this, I follow Bayesian statistical thinking in the sense of an a priori prediction that is updated frequently with each tournament giving new data. Like any statistical model, this will not be definitive as no one is able to fully predict the future but I hope this model will help people see the 'signal from the noise' in Smash Ultimate tournaments.
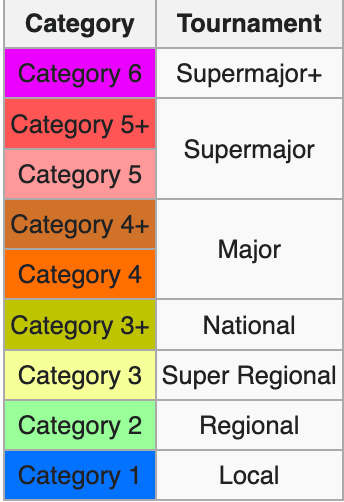
Thankfully, there have been several statistical contributions to Smash tournament results and one of which is my basis for my statistical model. Twitter user Easy Freezie has released his ranking of top Smash Ultimate players biannually based upon his ranking methodology. Essentially, he ranks each Smash tournament based upon number of entrants and then gives each player 'points' based upon how they performed according to the tournament they attended. For example, 1st place finish at a more local tournament with less than 100 entrants will yield less points than a 1st place finish at a major tournament with over 1000 entrants. He calls this ranking system Orion Rank and categorizes tournaments on a scale of 2-6:
After the results are finalized for these tournaments around the middle and end of every year, Easy Freezie releases his ranking of players based upon their points they have earned from their tournament performances. He ranks 150 players across the world with his latest here.
Because Smash tournaments are very competitive, there are minuscule differences between the players. They are so close that when these players match up head-to-head, the results are very close. To account for this, I wanted to categorize his rankings into 20 different tiers to gives me a solid statistical starting point for my a priori predictions.
In order to defeat an opponent in a Smash Ultimate tournament, you have to be the first to win 3 games. Once doing that, you proceed through a bracket until you lose twice in double elimination or win the tournament. This style is called Best of 5 and is instituted to account for the anything-can-happen nature of just one game. In a sense it patterns more after the NBA playoffs where you have to win a Best of 7 series compared to the NCAA March Madness tournament where you only need to win game to advance (hence the madness). Sweeping an opponent (3-0ing) would demonstrate superior skill compared to a close 3-2 set. As such I created an index that awarded more points to a player correlated to their margin of victory or defeat.
Now that numeric values are given to the skill level of opponents and the prestige of major tournaments, I set about acquiring data on players performance across several tournaments this year. The website start.gg records the results for nearly each Best of 5 set in a Smash Ultimate and I went about manually scraping the data there.
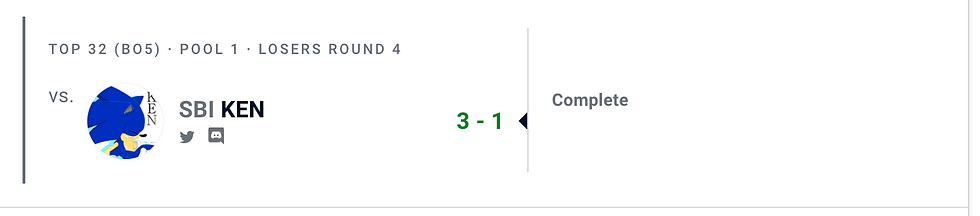
In the example above a player called Jake defeated opponent Ken by winning 3 sets and losing one. Ken is an opponent tier of 16 and by defeating him by a margin of 2 sets (3-1) at a level 4 tournament (Glitch Regen), Jake was awarded 60 points.

In addition, players are given points for the final placement at these tournaments so that more points are awarded based on placement and level of tournament. A player named Sonix finished in 1st place at CEO 2022 (4.5 category) and was awarded 225 points for that finish.

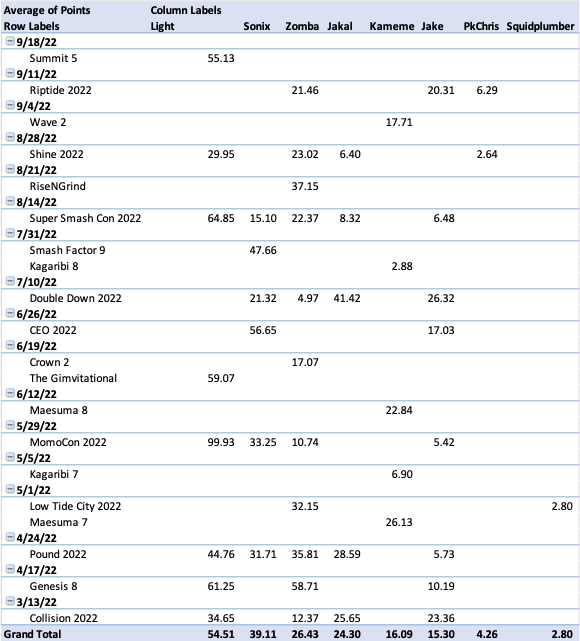
I used Excel as my main tool to house and analyze the data to make this model. While not as fancy or complex as another data analysis tool like SQL or Python, Excel offers the speed and simplicity in a model that continues to have data inputted. After scrapping and inputing the data in Excel, I created a pivot table that compared the point averages between players. I also used the vlookup function to automatically find and calculate points each player gets after a full set.
On September 25th 2022, these 8 players reached the Top 8 in the Glitch Regen bracket. Using my model I used the statistical method of z scores to compare each player to one another. Each player received a z score based on the mean and standard deviation of these top 8 players. Using the formula I used (Player1average - Player2 average) / AllPlayers Standard deviation. Once that score was found I used the Excel formula Norm.S.Dist to find a distribution percentage.
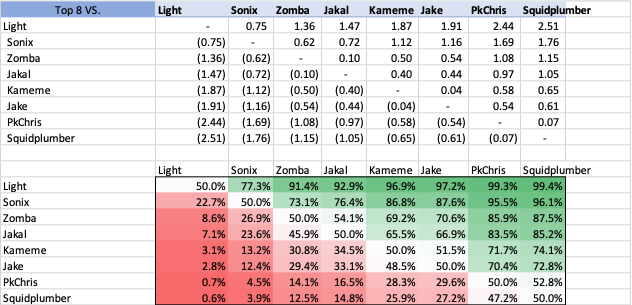
As you would expect if the players were play each other they would have an equal chance to win since they have the same results hence the 50% moving diagonally down the matrix. But it also gives us the percentage we are looking for in each matchups. According to this model Light is the best player and has over a 90% of defeating each of his potentials except for Sonix which winning percentage he has is 77%. Among the middle of the pack, a matchup between Zomba and Jakal would slightly favor Zomba by 54% of winning and a matchup between Jake and Kameme would favor Kameme by only 51.5% odds.
Here are the actual results of what happened:
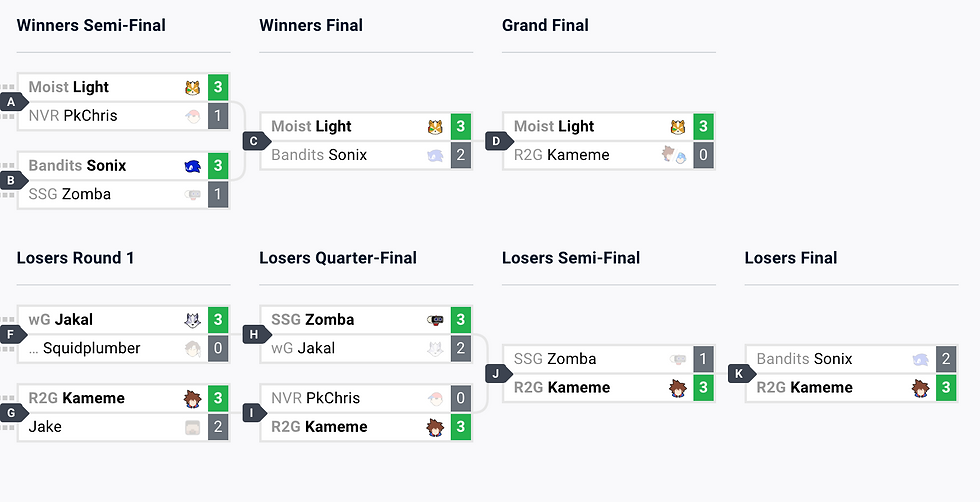
As predicted, Light won 1st place in the tournament defeating his opponents handily except for Sonix who took him to 5 games. The second place finisher Kameme had two upsets according to my model, over Zomba (30.8% odds) and over Sonix (13.2% odds). The rest of the matchups played out as predicted with the odds favorite winning. Of course, no model is able to accurately predict everything hence why there is a percentage. Kameme's performance happened to be one of the 3 in 10 chance of beating Zomba and the 1 in 10 chance of beating Sonix that day (earlier in the tournament Kameme actually did lose to Sonix 2-3).
In accordance with Bayesian principles, this new data of the Glitch Regen tournament was entered into my model, creating new percentages if these same players were to find themselves in a tournament Top 8 again.
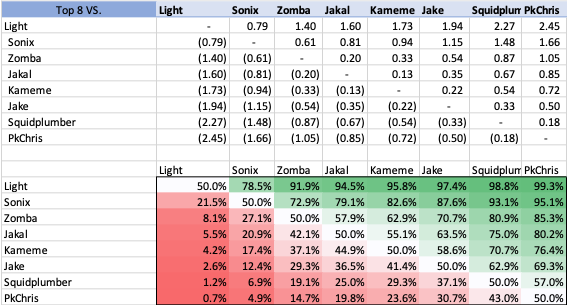
Sonix and Zomba would still be favored if they were to play Kameme again but this not by not as much. Also interestingly Squidplumber gained a higher z score than PkChris even though PkChris beat him and placed higher than Squidplumber at this tournament. But Squidplumber defeated more quality opponents en route to his finish over PkChris, hence the slightly higher z score after.
I was very pleased with this result for this particular tournament. While it was only one event, I believe this model to be a solid foundation for forecasting winners and losers. As more tournaments are played featuring more players, we will see if my model delivers similar accurate results.
In future iterations, I would want to potentially employ web scraping using Python's Beautiful Soup library. This would allow me to scrap and input a much larger quantity of data while minimizing human entry error. Doing this would also allow past performance of more players to expand statistical analysis there.
Overall, I was pleased to see my Excel and statistic skills put to use in an applicable setting of which I enjoy in my free time. I plan on updating and using this model as more Smash Ultimate tournaments take place. I'm reminded of one of DraftKing's, a popular sports gambling site, axioms which is "we believe life's more alive with skin in the game." I find that to be true in the esports scene as well and creating this model has done that for me and I hope others may use it and find the same for themselves.


Comments